- In ZLT main window, select Chart->Chart ...
- In the ZereLine Chart window, selectFile->New Workspace to create a workspace.
- Select File->New Chart ...
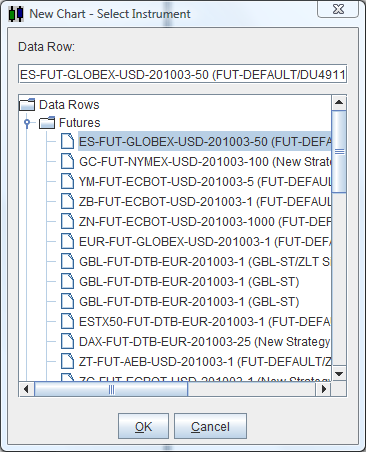
- In the New Chart dialog, select a data row and click OK.
- In the Chart Settings dialog, set the desired Field to Chart and Bar Period.
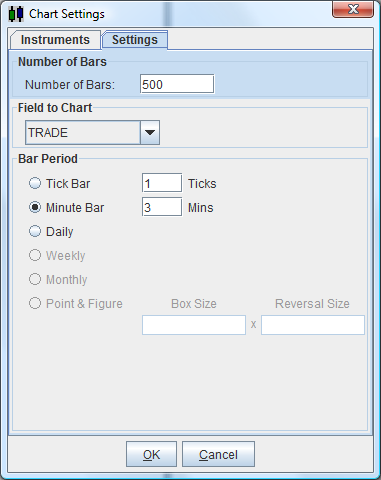
- Click OK in the Chart Settings dialog.
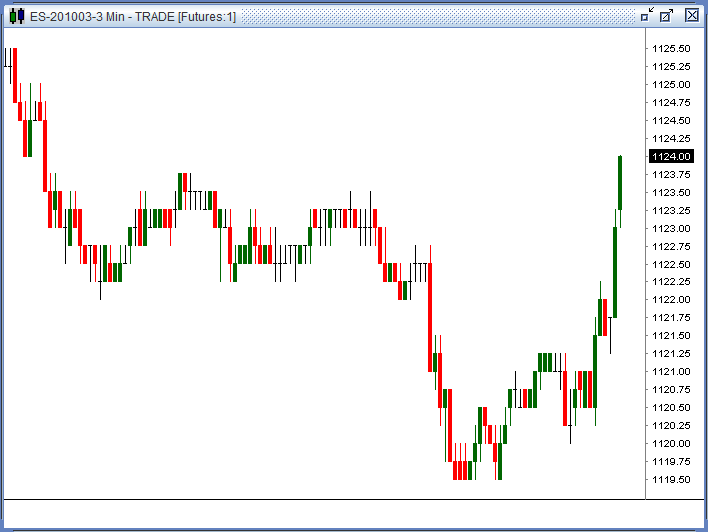
- The chart window will open and starts to retrieve historical data.
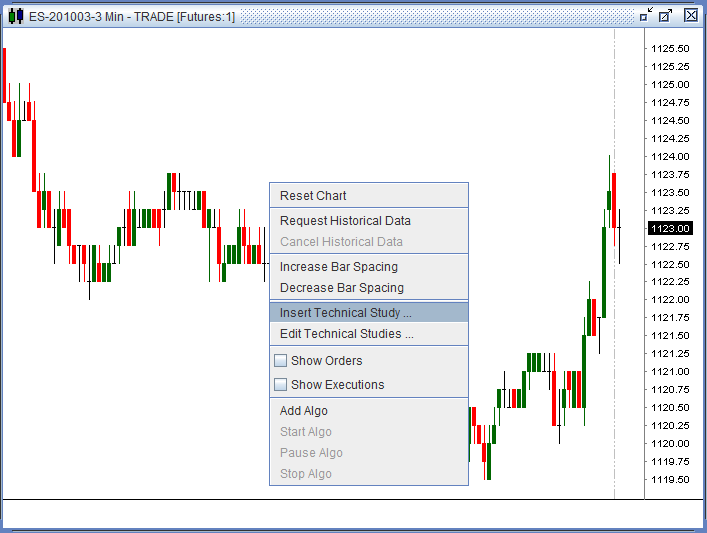
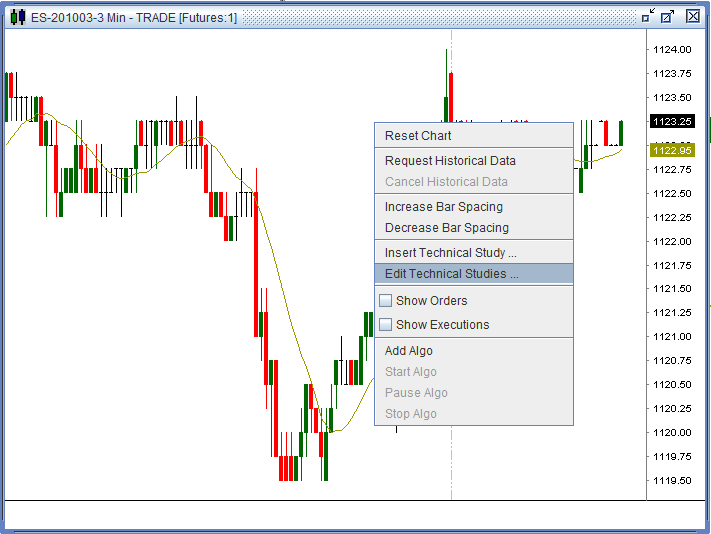
- Right click in the chart window and select Insert Technical Study ...
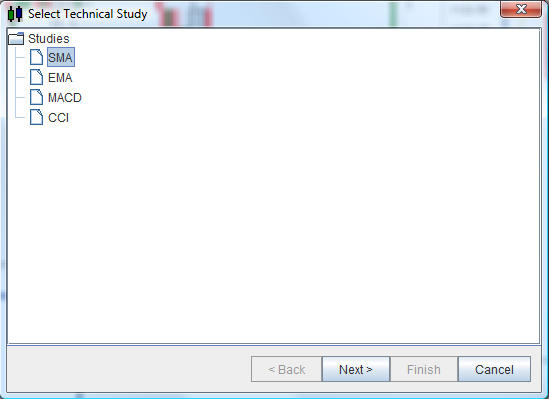
- In the Select Technical Study window, select a study such as SMA (Simple Moving Average), click Next
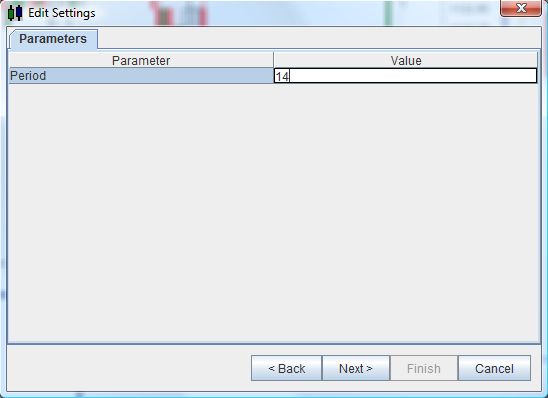
- In the Edit Settings window, double click the Value cell to edit the value of the corresponding study parameter.
Remeber to click Enter key to commit the change.
Click Next.
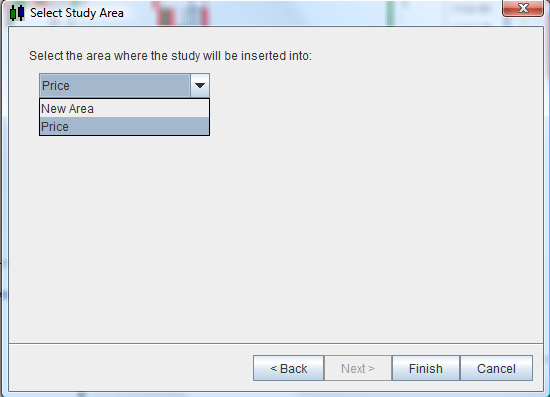
- In the Select Study Area window, select Price in the combo box.
The Price is selected because we are adding a moving average and prefer to draw it in the same area as the price bars.
If we are adding studies such CCI or MACD, select New Area.
Click Finish.
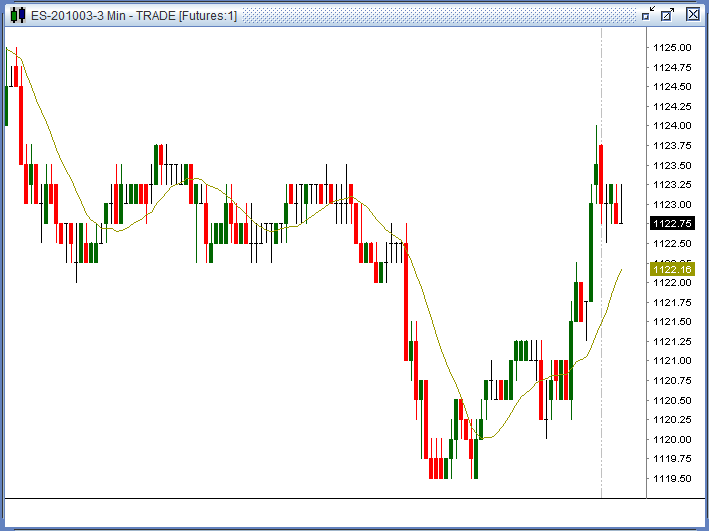
- Note the SMA is now drawn with the price bars.
- Right click on a chart and select Edit Edit Technical Studies ...
- In the Edit Studies window, right click on the study you wan to remove and select Delete.
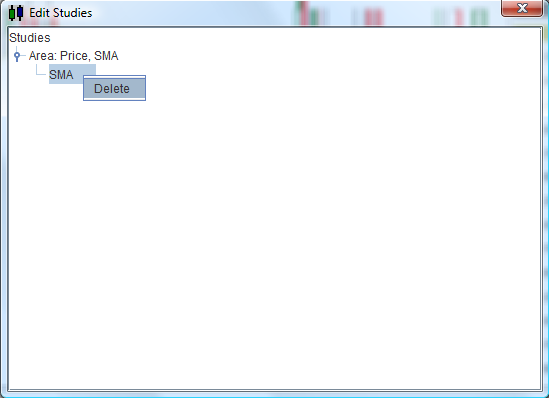
- Select Yes in the Delete Study Confirmation dialog.
- Note that the study is removed from the chart.
- Close the Edit Studies window.
Notes:
- You can update the chart with historical data any time by right clicking in the chart window and select Request Historical Data.
- If it has taken to long to get the historical data, you can cancel the request by right clicking in the chart window and select Cancel Historical Data. Then you can request the historical data again.
- Once you have the chart, you can move the chart horizontally by moving the mouse while the right mouse button is pressed. (Right click in the chart window and select Reset to reset the chart.)
- To adjust the bar width, just scroll the mouse wheel while the right mouse button is pressed.
- To adjust the bar spacing (the space between two bars), right click in the chart window and select Increase Bar Spacingor Decrease Bar Spacing.
- Only the market data which are during trading sessions will be charted. To define sessions, click Data->Instruments ... in ZLT main window. Then double click an instrument line in the Instruments window. In the Sessions tab of the Edit Instrument dialog, from the right click popup menu you can insert or delete session or just load the default sessions. The session time can be defined in GMT, your local time zone or the exchange time zone.
If you find the default session or the exchange time zone for the instruments you are trading are not correct, please email me atsupport@zerolinetrader.com.